Find which settings help
Compare precision, KV cache, decoding and concurrency on the same workload. Each candidate is checked against quality and performance requirements before it reaches the final shortlist.
Open models demand a deeper level of engineering: more settings to check, more ways to run them, and more performance to unlock.
RadianVector has built tools that explore these settings and measure the outcomes, with AI agents orchestrating the experiments to find what matters.
Read how our tools found a vLLM output bug and helped test a fix →
Find which settings make a differenceOur tools help teams inspect and improve inference systems. inferlint is one you can use today. Internally, it is one in a growing list of tools our AI agents use to measure results and search for better configurations.
For vLLM, SGLang and TensorRT-LLM. Run inferlint around an existing benchmark: it reads the server’s boot log, Prometheus metrics and GPU process state, and generates a self-contained report showing achieved concurrency, queueing, KV-cache use, preemptions and teardown.
Each engine can change the numbers without raising an error. vLLM preempts a running request and writes no log line. TensorRT-LLM pauses requests for recompute and counts none. SGLang can lower its running limit at start-up and still report the limit it was given. inferlint flags each of these when it happens, so the load a benchmark requested can be checked against the work the server actually ran.
pipx install inferlint
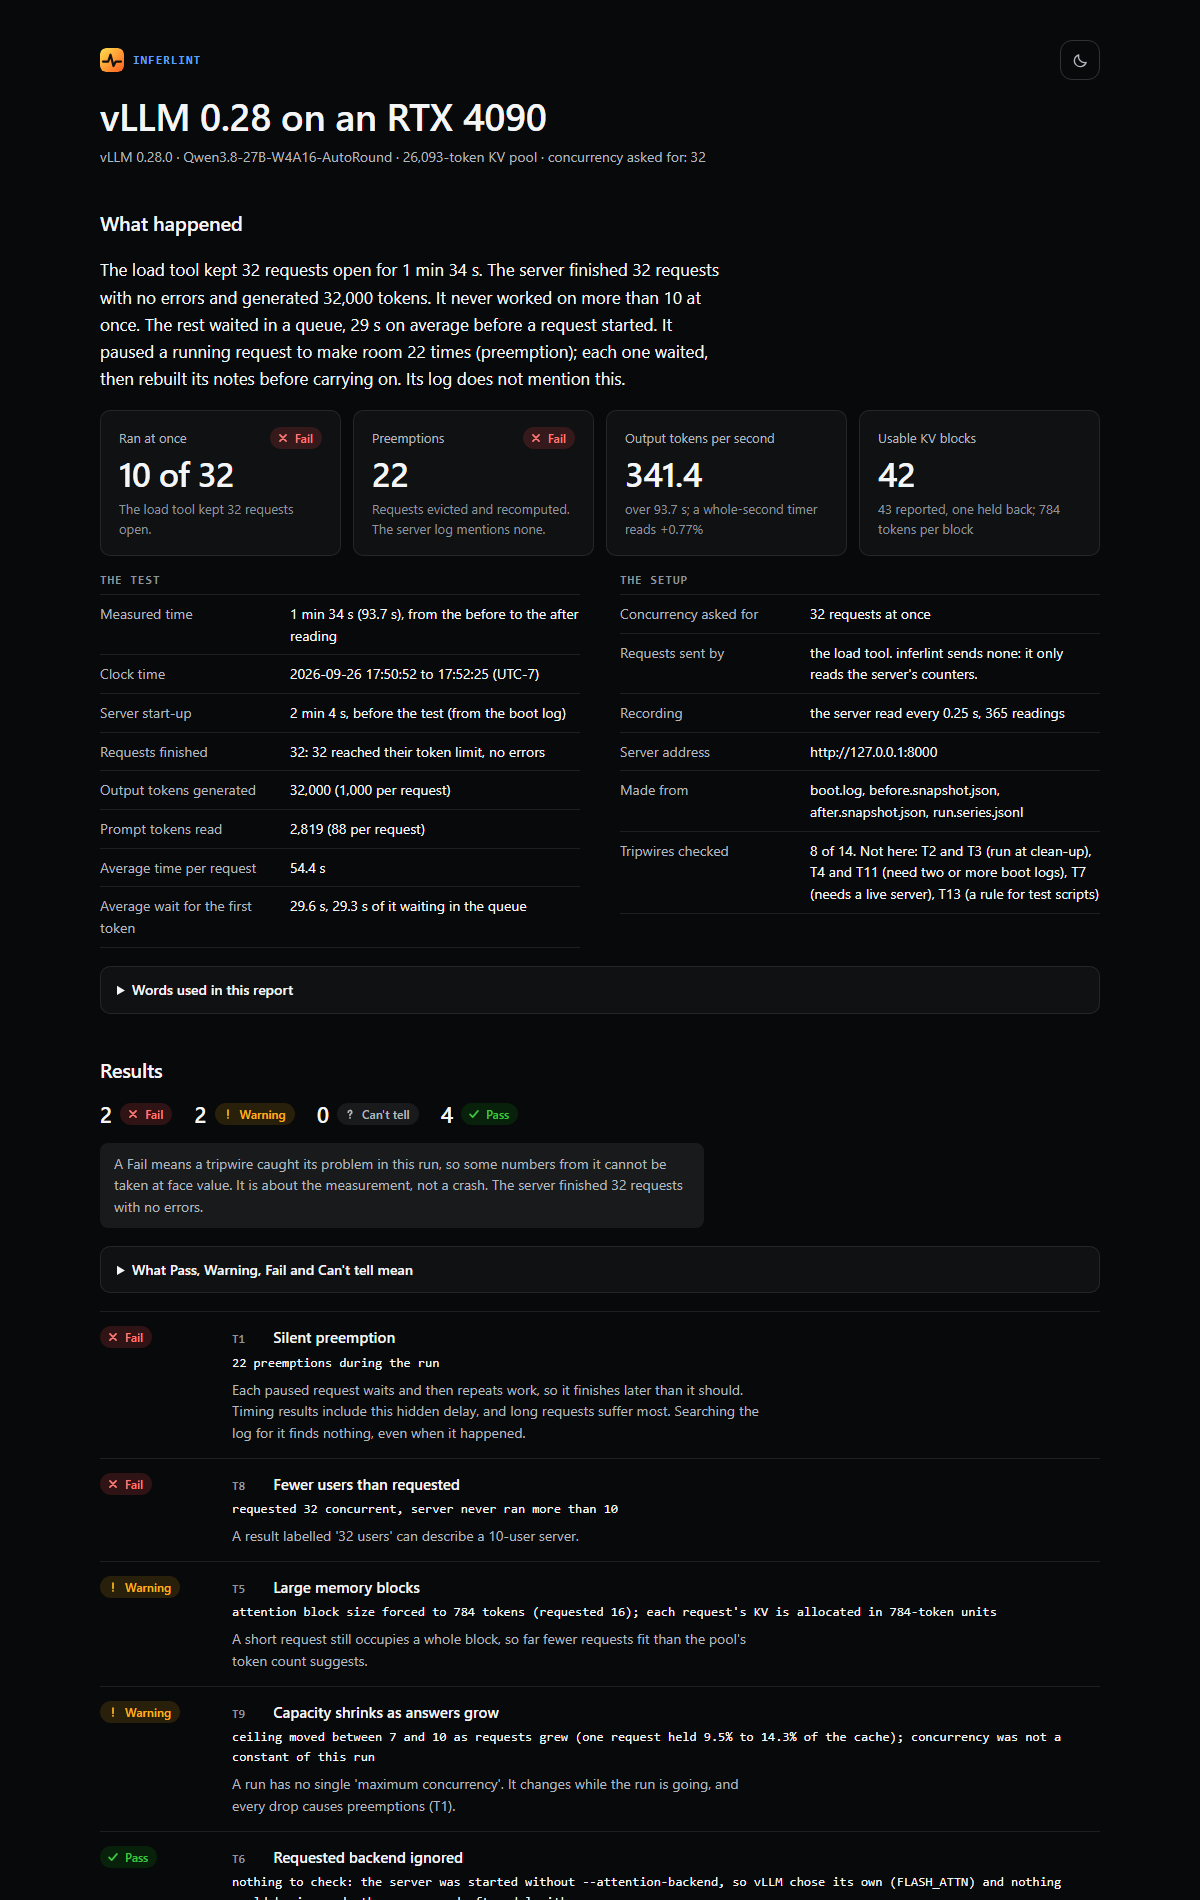 Actual inferlint report · Open the example
RadianVector tools compare task results with serving measurements. Keep tested settings, failure examples and the operating conditions for each result.
Compare precision, KV cache, decoding and concurrency on the same workload. Each candidate is checked against quality and performance requirements before it reaches the final shortlist.
Compare configurations on company-specific tasks with the same requirements. Report task results, important failures, response time and resource use together.
Keep the runtime version, model build, hardware and serving settings behind each result, so every configuration can be reproduced.
AI agents orchestrate the experiments: they choose the next settings to try from earlier results, run the comparisons and flag what matters.
Precision, KV cache, batching, parallelism and decoding interact. A change that improves speed can also affect answer quality or memory use.
RadianVector tools compare supported settings and record their effects on your workload. Explore how configuration affects AI performance →
The right combination of serving runtime, precision, batching, parallelism and decoding can reduce time to first token and preserve generation speed as concurrency rises. The result is visible in response time, queueing and the number of users the deployment can serve.
Well-chosen weight and KV-cache quantization can free memory for longer context windows, larger batches or more concurrent requests. We measure the capacity gain beside workload quality, because a configuration that fits more work but changes the answers is a trade-off, not a free improvement.
Uptime and GPU utilization describe whether the deployment is running. They do not show whether another compatible configuration would answer faster, fit more work or preserve quality at lower cost.
Hardware, memory and runtime compatibility define which configurations can run. Compare those candidates on your workload, then check promising combinations against quality and performance requirements. The diagrams below illustrate the search and the trade-offs to measure.
Candidates are compared across quality, speed, capacity and cost. Your requirements define the acceptable region; the measurements reveal the frontier inside it.
A candidate can combine a model, quantization, compiler and serving runtime. RadianVector tests those combinations under a defined workload and records quality, speed and memory behavior. Final selection follows your acceptance criteria and held-out results.
When runtimes, kernels or formats change, earlier evidence provides the starting point for the next search.
INT4 saves more memory and holds up on short answers and classification, but long-context tool use falls sharply. It is rejected unless those requests can be routed elsewhere.
Illustrative — this is the shape of the output, not a measured result.
Start by measuring the system you have. Use that baseline to check whether each change helps.
A new checkpoint, runtime, driver, hardware target, system prompt or workload can change the result. Revalidation starts from the saved baseline and reruns the measures affected by the change.
Review a changeIllustrative workflow — the actual result depends on your model, workload, constraints and hardware.
RadianVector reruns the same evaluations against the saved baseline, so regressions and performance changes show up before release.
→ The runtime upgrade you're about to take improves throughput, but tool-calling accuracy drops on your workload.
→ The new checkpoint holds quality at a lower precision than the old one did. You can drop a tier and stay above your floor.
Examples of the form, not results we are reporting.
Keep workload requirements, tested settings and validation results together.
A versioned workload with the source context, scoring rules and failure categories that matter to your team.
The current setup, repeated runs and operating conditions against which candidates are compared.
Supported model and serving settings that meet your requirements, with rejected candidates and their reasons.
Finalist results on cases reserved from the search, with repeated runs and important failure examples.
The model build, runtime version, hardware and launch settings behind the chosen configuration, ready to apply.
Tasks, configurations, measurements and scoring for checking the next model, runtime or workload change.
New accelerators, quantization formats, runtimes and kernels continually change the available configuration space. The evaluation process is designed to admit new candidates as they become usable.
Client names, model weights, prompts, datasets and results are not published without written permission.
RadianVector tests models and deployment configurations independently of the team making the product claim. Our tools generate reports documenting the method, configuration, operating conditions and material limitations.
RV-380 is one published example of our evaluation method: a fixed, code-scored dataset used to compare configurations question by question and measure run-to-run disagreement. For other models and workloads, we can generate or assemble larger, more varied evaluation sets around the target domain, difficulty and failure modes. In one published comparison, MTP depth 1 increased throughput by 7.4% at six concurrent users and reduced short-answer accuracy by 6.5 points. Both numbers came from the same experimental arm.
Evaluate the model with the quantization, runtime, hardware and serving configuration intended for deployment.
Use the result as a private decision record or as the basis for a public third-party report with traceable measurements.
Retain the tested settings, tasks and scoring to compare the next model, runtime or hardware change against the same baseline.
Each study includes the deployment conditions, experimental design, raw figures, corrections and results that did not support the expected conclusion.
A joint performance-and-behavior comparison across quantized builds, cache formats, execution modes, speculative decoding and concurrency. Four quantized builds, speculative decoding, KV-cache precision and concurrency from one user to thirty-two, all measured on the RTX 4090 GPU family with 24 GiB of GPU memory.
On this model, MTP depth 3 reduced short-answer accuracy by 11.9 points. Under full reasoning, the measured loss was 1.2 points. The study reports speed and quality by arm.
Read the studyThe same 380 questions with the model’s native reasoning mode switched on, across every setting it offers. What each step of the effort dial buys in accuracy — and what the same step costs in wait, throughput and how many users still fit.
The short version: turn it on, and the gain has almost entirely arrived by the lowest setting. The template’s own default is the expensive end of a curve that flattened two settings earlier.
Read the studyTell us what you run and where it falls short, even if you are not sure why. We will work out with you what to measure, from answer quality to latency and capacity.
Reach out and send us a note. We’ll take it forward from there.